
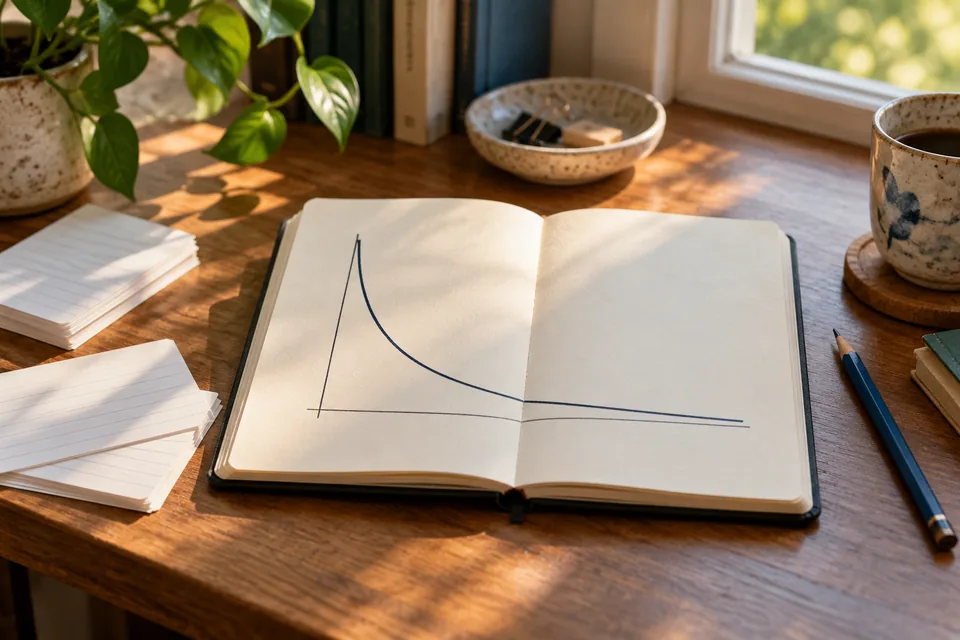
A slippery slope
The forgetting curve describes how memory for newly learned material declines over time, often quickly at first and more slowly later. Its famous early experiments involved Hermann Ebbinghaus learning lists of nonsense syllables.
Yes, he gave himself homework made of words that were not words.
The clever measure
Ebbinghaus compared the time needed to learn a list with the time needed to relearn it after a delay. Murre and Dros explain this measure, called “savings”, in their 2015 replication.
Imagine learning something in ten minutes, then relearning it in six. That saves four minutes: 40% of the original learning time, not 40% of the answers remembered.
A blank is not the whole story
Something that will not come to mind can still be easier to relearn. That is why relearning time and getting an answer right measure different things.
The replication involved one participant. Its graph is not a universal timetable telling you exactly how much everyone forgets after an hour.
Give the answer another go
For a practical next step, explore ways to remember a quiz answer. Start with one question you missed and try explaining the answer without peeking.
A blank moment need not mean you are starting from scratch.