
How much water goes past?
River discharge is the volume of water passing a point on a river in a given time. It is often given in cubic metres per second, written m³/s. If the discharge is 6 m³/s, six cubic metres of water pass that point every second while the rate holds steady.
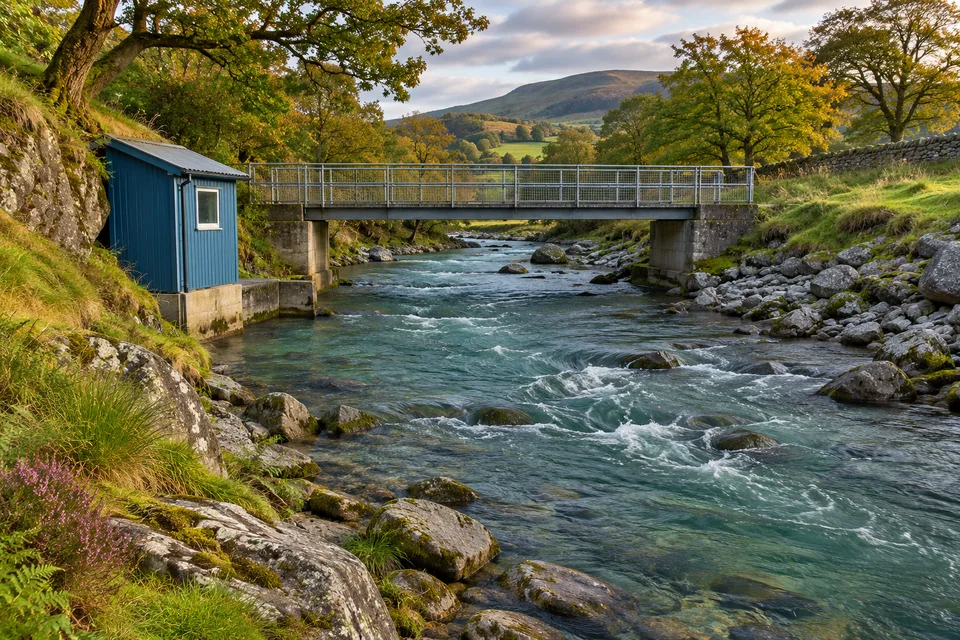
Think of looking straight across a stream from a bridge. Imagine a flat slice across the water, all the way from bank to bank and from the surface to the bed. How much water passes through that slice depends on the area of the slice and how quickly water crosses it.
Try a simple measurement on paper
Imagine a rectangular channel 4 metres wide, full to an average depth of 0.5 metres, with a mean water speed of 3 metres per second. The cross section is 2 square metres. Multiply that by 3 metres per second to get 6 cubic metres per second.
Now keep the same cross section and cut the mean speed to half. The discharge also halves, to 3 m³/s. By keeping the channel the same in the example, you can see just what the change in speed does.
Natural channels have irregular beds and varying speeds. Surveyors can split a cross section into smaller parts, estimate the flow through each part and add them together. The little rectangle above is a practice model, with invented measurements.
What a gauge can tell you
River stage is the water level above a fixed reference at a measuring site. The US Geological Survey measures discharge at different stages to build a relationship for that site. With that relationship, a gauge reading can help estimate discharge later.
Double the stage and you do not necessarily double the discharge. The river’s shape affects how much extra area the water gains as it rises. If it spills onto a wide floodplain, a small rise in level can open up a much wider route for the water.
Follow a storm in a graph
A graph of discharge over time is a hydrograph. The US Geological Survey shows a storm followed by an increase in flow in Peachtree Creek. A discharge graph tells you when the river was carrying the most water at the measuring site.
The station sees only the water passing it. To think about where the extra water came from, go back to the watershed above that point. Rain can reach the channel by several routes and on different timescales.
The graph records how much water went past. To understand a change you might see in the water itself, read why rivers can turn brown after rain.