
A line at one height
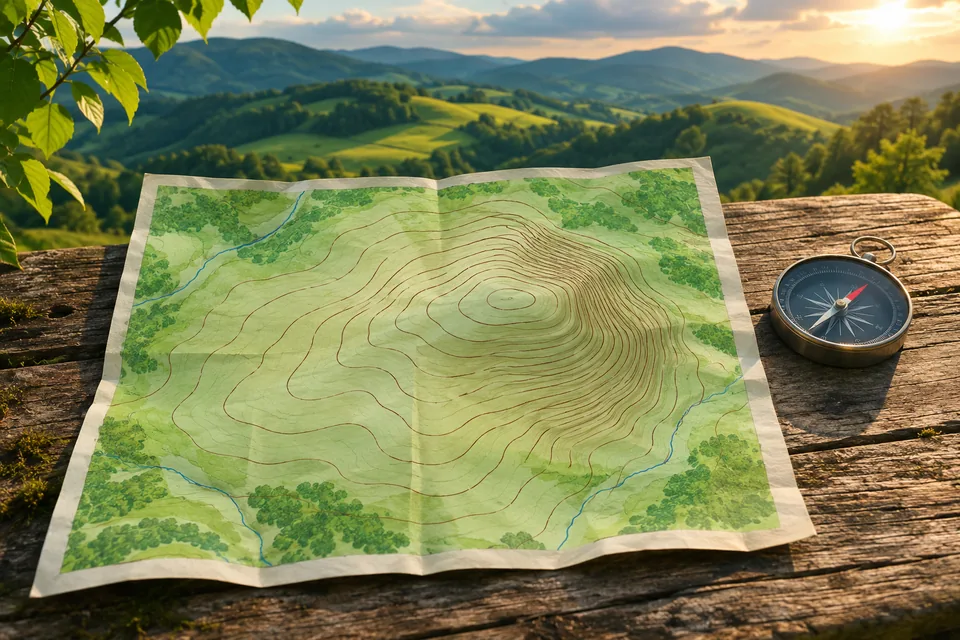
A contour line joins points at the same height on a map. Its number tells you the elevation, usually relative to sea level. Follow that line around a hill and the stated height stays the same.
That is how a flat sheet can describe land that rises and falls. Ordnance Survey’s map-reading guide explains the lines and their labels on pages 10–11. Think of a contour as a line around the hill, rather than a path leading to its top.
Read the gap between the lines
The contour interval is the change in height between neighbouring contour lines. Check the map key: the interval is not the same on every map.
On the same map, closely packed contours show a steeper slope. More widely spaced contours show a gentler slope: the same rise is spread over a longer ground distance. Geoscience Australia includes this distinction in its introduction to topographic maps.
Count the height steps, not the ink
Try a made-up map with a 10-metre contour interval. A route crosses lines labelled 100 m, 110 m, 120 m and 130 m, always heading uphill. The rise from the first line to the last is 30 metres.
There are four lines but only three gaps between them. Counting four lots of ten would add an extra step. The calculation also does not tell you how far you have walked: height gained and distance travelled are different measurements.
Put the map together
A coordinate pair helps locate a place. Map scale helps turn a measured gap into a ground distance. Contours add the height and shape of the land. A short route on paper may still cross a steep slope.
Connect the three ideas in Read a world map, or browse the geography terms guide for the shapes along the way.
Contours can also help you spot the ridge in a mountain’s rain shadow. Add the wind direction to see which slope faces the incoming air.